
Although warranted and much needed, the path to transition our healthcare system from reimbursement models that pay for volume of services to those that reward for value and positive outcomes it is not an easy one to travel. While there is an across-the board agreement that value is a much better concept to base payments on, getting there is a slow and complex endeavor in the convoluted world of healthcare reimbursements. However, as our healthcare system continues to move toward value-based systems, it is important for laboratory professionals to understand how this shift impacts their service and where laboratory data comes into play in value-based contracts. In an effort to increase your laboratory’s value and extend your reach beyond the lab, knowledge about your facility’s involvement in value-based contracting is essential.
Triple Aim Goals: Moving Away from FFS
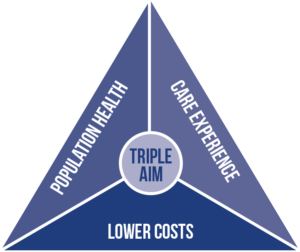
Healthcare’s Triple Aim goals include improving the health of the population, improving the patient experience, and controlling escalating costs. Historically, healthcare has operated with fee-for-service (FFS) payment models in place that focus on delivering the greatest number of services to the most patients possible according to a fee schedule. Yet, the FFS system does not reimburse for important care elements that could help prevent an office or emergency department visit (e.g., patient phone calls, care coordination, chronic care manager salaries, or consideration of patients’ social determinants of health).
 In contrast, the goal of value-based care is to improve the quality of care and patient outcomes while simultaneously reducing healthcare costs. A shared savings or value-based contract (VBC), where quality is measured and costs are kept below a defined threshold, results in a larger pool for reimbursements, so both quality outcomes and conscientious spending are incentivized.
Healthcare facilities must provide the highest quality of care at the lowest possible cost. This means minimizing repeat visits and unnecessary procedures and focusing on proactive wellness and preventative treatments. At this point in the value transition, most organizations are participating in some form of value-based contracting, paired with FFS payments.
Under a capitated plan, providers receive a fixed per-person payment that covers all healthcare services over a defined time period, adjusted for each patient’s expected needs. Providers are financially incentivized to eliminate waste in the system and are accountable for quality patient outcomes. Capitated models align care incentive management between insurers and providers.
Levels of Risk: Reimbursement Models

The progression is from an FFS mindset to a shared savings pool (upside risk), to downside risk, to fully capitated payments (See Figure 1).
Shared Savings: ACOs
One step away from FFS payments are shared savings models that reward providers for reducing healthcare spending below an expected target set by the payer while simultaneously meeting specific quality measures. The provider gets to share in the collective pool of savings. Models that allow participants to share in healthcare savings if their services make care delivery more efficient are also referred to as upside or one-sided risk.¹
Medicare uses the shared savings model in its Physician Group Practice (PGP) Demonstration and its Accountable Care Organization (ACO) models. An ACO is a network of providers and healthcare facilities that share financial risk for providing healthcare services. The majority of the early ACOs involved shared savings or upside risk-only arrangements. Moving forward from 2019, all ACOs involve varying levels of downside risk.
Shared Risk: Value-based Contracting
Shared risk models are the next level of risk arrangements, under which providers receive performance-based incentives to share cost savings alongside disincentives to overspend (see Figure 2). This model is based on an agreed-upon budget with a payer, and calls for the provider to cover a portion of costs if savings targets are not achieved.¹ In this type of downside risk arrangement, providers not only gain for quality outcomes, but they can lose revenue if their care exceeds the agreed-upon financial thresholds. The two-sided financial risk implementation that includes both upside and downside risk promotes greater accountability for both quality care and cost expenditure.
Value-based contracting generally includes performance-based reimbursements tied to indicators of value (e.g., patient outcomes, operational efficiencies, improved population health, quality, etc.).
VBC helps align incentives among stakeholders, such as healthcare organizations, manufacturers, or payers, with mutually beneficial goals across the risk- sharing stakeholders. Its collaborative setup encourages parties to work together to achieve performance goals. While providers may still be paid FFS for some of their payments, they may also be paid a bonus or have payments withheld.
In a VBC arrangement, stakeholders are committed to be responsible for delivering defined services to a specific population at a predetermined price and quality level. Providers assume downside risk for:
- not meeting targeted population health measures
- costs above target
- missing quality thresholds
Upside financial incentives occur when population health measures, care costs, and quality targets are exceeded. Anticipated benefits for stakeholders, including patients, include:
- compensation commensurate with quality and outcomes
- improved efficiencies
- better outcomes
- better access to care³
Value is measured through a combination of quality, cost efficiency, and patient satisfaction indicators. There are multiple entities that determine and disseminate measures. Commonly used indicators include Medicare’s Star Rating System, Healthcare Effectiveness Data and Information Set (HEDIS) measures, and National Quality Forum measures.⁴
Full Risk: Capitation Models
Under a capitated payment model, an HCO, or group of organizations, receives a predetermined payment per patient for specific medical services as a per member-per-month (PMPM) amount. In this scenario, providers take on full risk for the covered patient and services. PMPM fees are determined by actuarial analysis of historic costs of the patient population and are adjusted to reflect the risk level associated with the specific patient population.¹
Fully delegated risk occurs in Medicare Advantage (MA) when a payer “delegates” the risk of paying claims to a provider group. This involves a complex negotiation between payers and providers and includes a negotiated percentage of premiums that the provider group receives to manage and pay for all claims in their MA patient population. Payments from the Centers for Medicare & Medicaid Services (CMS) to payers are largely determined and controlled annually by Risk Adjustment Factor (RAF) scores.
Understanding Medicare
 To fully understand where MA fits in the reimbursement scheme, it is important to note that there are thousands of variations of Medicare plans offered by numerous insurance companies across the United States. More than 57 million Americans utilize Medicare and private plans, such as MA.
Medicare includes four parts: A, B, C, and D. Each person with parts A and B gets similar coverage; therefore, parts A and B are not “rated.” Parts C and D are given a rating because they involve individuals working with private insurance companies to find a plan that works for them.
Parts C & D
MA plans are part C and are acquired through private insurance companies approved by Medicare. These plans cover everything that parts A and B cover, but they may also offer prescription drug coverage, dental and vision, and other services. Health Management Organization (HMO) plans and Preferred Provider Organization (PPO) plans are the most popular MA plans acquired through private insurers. Part D plans cover prescription medication with varying options for premiums and deductibles.
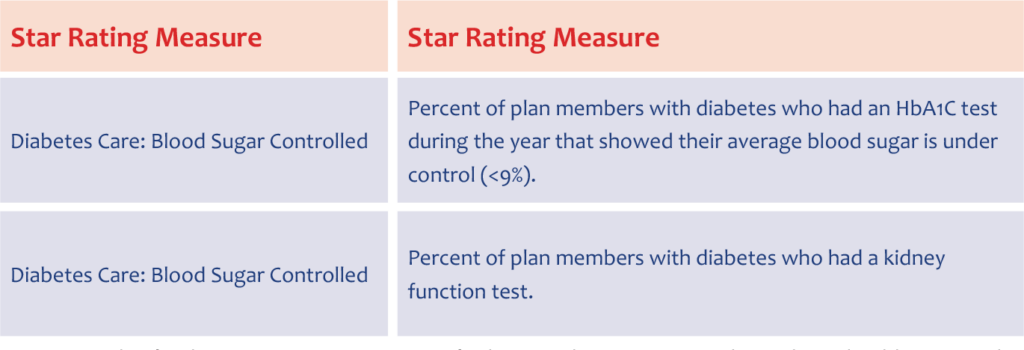
CMS rates part C and part D plans on quality from one to five stars, with five representing excellent performance and one reflecting poor performance. CMS pays bonuses to plans with high ratings. To assign stars, CMS analyzes how health plans perform on various measures, such as breast cancer screening, colorectal cancer screening, annual flu vaccinations, improving or maintaining physical/mental health, and monitoring physical activity and body mass index assessments.⁵ As examples, two specific measures for chronic disease management that are included in almost every value-based contract are laboratory testing for diabetes and chronic kidney disease (see Figure 3).
Medicare Advantage
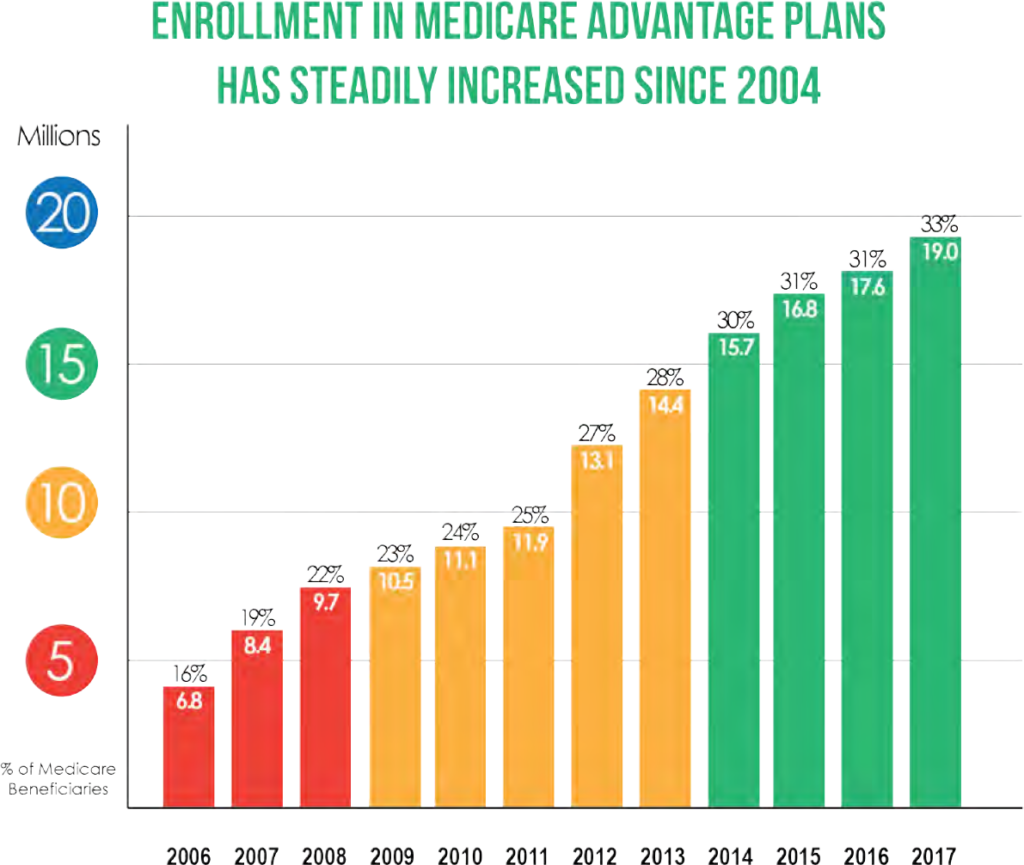
MA is the fastest-growing healthcare insurance in the United States, and this number is expected to continue rising (see Figure 4). Nearly one-third of the 57 million Medicare beneficiaries are covered by private MA plans, and federal officials estimate that this proportion will rise to 41% over the next decade. Enrollment in MA plans increased from 18.4 million in 2016 to 22.8 million in 2019.
Traditional MA plans include some FFS payments plus bonuses from the shared savings pool. The flow of payments goes from the government to the payers to the medical group. Commercial payers are active participants in shaping the details of a medical group’s value-based contract through selection of specific quality measures in areas where that practice can readily see improvement, allowing for local execution of the VBC.
Some MA plans are experimenting with innovative risk-sharing arrangements with providers, from upside-only bonus contracts to fully delegated risk and capitation.⁶ Fully delegated risk MA programs are less common but are a growing trend as these plans offer benefits for all stakeholders. In this type of MA plan, monies flow directly to the medical groups, who then pay claims. Fully delegated MA gives providers more money up front and greater control over patient care. Consequently, providers make a greater effort to keep patients healthy and avoid unnecessary costs.
MA models include four foundational principles:
- Strategic contracts
- Accurate coding and documentation
- Star Ratings
- Care management
How Risk Is Calculated
A full-risk reimbursement model makes it imperative that patient health status is precisely coded to represent an accurate level of risk. Outcomes can be significantly skewed if coding is not performed completely and accurately. For risk-based payment programs, risk scores are determined using the Hierarchical Condition Category (HCC) risk adjustment model.
Hierarchical Condition Categories
CMS uses HCCs to calculate risk scores, ranking diagnoses into categories that represent conditions with similar costs. Patients within higher-risk categories are likely to incur higher healthcare costs, thus have higher risk scores.
CMS’ HCC risk adjustment model is prospective, meaning it uses health status data from a base year to predict costs and establish reimbursement for the next year. In addition to diagnoses, Medicaid status, gender, aged/disabled status, and whether a patient lives in an institution are factors included in the risk adjustment scores.⁷ HCCs allow CMS to reimburse based on the actual costs of care for each individual patient instead of using a less-accurate average for all patients.
Risk Adjustment Factor
CMS’ HCC risk adjustment model assigns a risk score, or RAF, to each beneficiary based on their health conditions that fall within an HCC. The RAF intends to predict the likely costs that a beneficiary will incur based on their health status and is used to adjust capitated payments for MA beneficiaries. Because payments vary according to predicted risk level, correct payment depends on complete and accurate reporting of patient data.

Chronic conditions, such as diabetes, chronic obstructive pulmonary disease, and congestive heart failure, will fall within a risk-associated HCC, but acute illnesses and injuries will not because acute conditions are not predictable, thus not associated with long-term costs. In order to determine a risk adjustment, ICD-10-CM (diagnoses codes) must be documented in the patient record based on a face-to-face encounter at least once per year.
Each January 1, RAF scores reset to the patient demographic baseline and CMS requires providers to identify all conditions that fall within an HCC at least once annually. Non-specific diagnoses or missing information can have a detrimental effect on patient outcomes and reimbursement for that patient’s care.⁷
How Performance Is Measured: Quality Performance Metrics
Another important factor in value-based reimbursement models is measuring quality patient outcomes. Again, it becomes necessary to comprehensively and accurately capture patient health statuses to ensure better care outcomes and improved population health management. There are several systems available for reporting quality measures (e.g., HEDIS, Medicare Star Ratings, Core Quality Measures).
 HEDIS®
Under CMS direction, the National Committee for Quality Assurance (NCQA) developed standardized performance measures—the Healthcare Effectiveness Data and Information Set—that allow for health plan performance comparison in regard to quality. HEDIS was developed to evaluate special needs plans (SNPs), which are MA care plans designed to provide targeted care for special needs patients. HEDIS measures determine if certain services are improving beneficiary health conditions.
More than 90% of health plans (including commercial, Medicare, and Medicaid) in the United States use HEDIS as a tool to measure quality of care and service performance. HEDIS intends to allow for an “apples-to-apples” comparison of healthcare plans for both employers and consumers.⁹ Precise risk adjustment allows HEDIS measures to provide a more accurate comparison of health plans.
HEDIS measures are extremely granular with detailed reporting requirements that are updated yearly. HEDIS includes more than 90 measures across six domains of care:
- Effectiveness of Care
- Access/Availability of Care
- Experience of Care
- Utilization & Risk-adjusted Utilization
- Health Plan Descriptive Information
- Measures Collected Using Electronic Clinical Data Systems
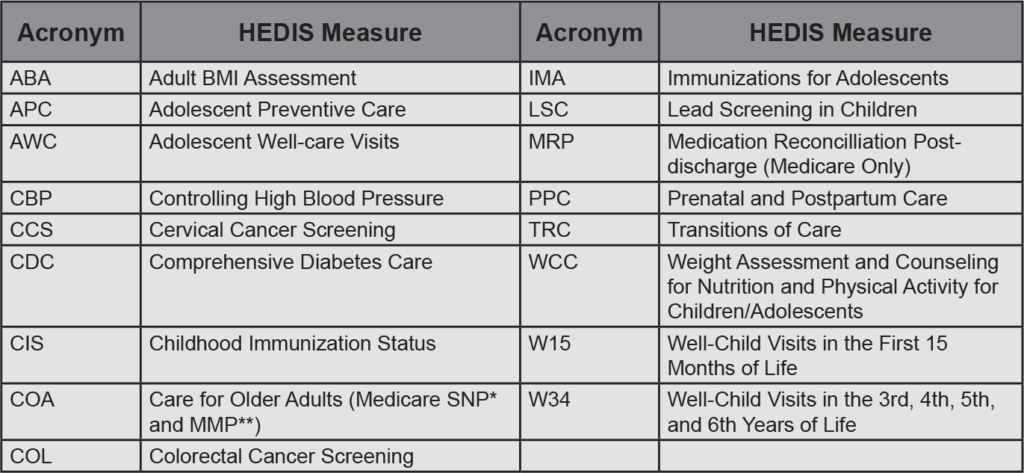
Some common HEDIS quality measures include immunization status, cancer screenings, asthma medication management, heart attack treatment, mental healthcare, flu shots, and high blood pressure treatment (see Figure 5). To achieve an accurate HEDIS “rating,” it is imperative that all services provided are accurately coded, including use of CPT II billing codes to help increase captured scores.
HEDIS quality measures help close gaps in care and decrease the use of costly acute care through preventive services. Accurate documentation is necessary to achieve higher HEDIS scores. Proper documentation of patient services helps identify care gaps and meet HEDIS quality measures. Common chart deficiencies for HEDIS diabetes care tracking include incomplete laboratory testing information (see Figure 6). Population health management, patient data analytics, patient outreach, and patient engagement are also important factors that, when implemented, can effectively help improve HEDIS scores.¹⁰
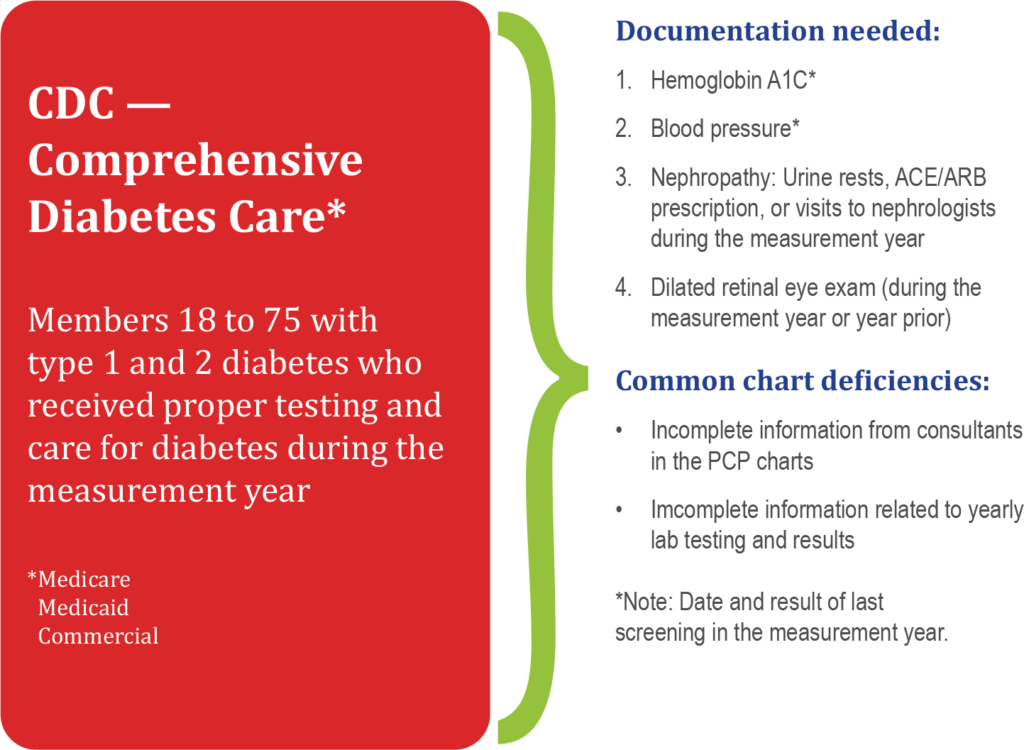
tracking include incomplete laboratory testing information.8
Medicare Star Ratings
 Medicare ranks MA and part D plans on a quality scale of one to five stars, with five indicative of excellent performance and one reflecting poor performance. According to CMS, in 2019, most beneficiaries were able to select an MA or part D plan with four or more stars.
The Affordable Care Act designated CMS Star Ratings as the measure for quality-driven bonus payments for MA plans. Star Ratings are used to score quality of care and customer service performance in several categories as well as for an overall rating that can be used to compare overall plan performance. Medicare reviews plan performance each year and new ratings are announced each fall.
MA plans are rated on their performance in five categories:
- Staying healthy: Screenings, tests, & vaccines
- Chronic conditions management
- Member experience: Plan responsiveness & care
- Member complaints
- Customer service (Medicare Interactive)
MA plans must score four or five stars to be rewarded in the Star Rating System. Plans can reward providers for improvements in specific categories. Star Ratings are intended to ensure high-quality plans and profitability for partnered provider networks. MA plans that score less than four stars are often unable to succeed long-term and risk contract termination.¹¹
Core Quality Measures
In 2015, America’s Health Insurance Plans (AHIP) initiated the Core Quality Measures Collaborative (CQMC), which is a multi-stakeholder, voluntary effort designed to align quality measure across the healthcare system for public and private payers. Participants include CMS, Blue Cross Blue Shield Association, primary care and specialty societies, and consumer and employer groups.
The CQMC measures patient outcomes within eight benchmark sets:
- ACOs, Patient-centered Medical Homes, & Primary Care
- Cardiology
- Gastroenterology
- HIV & Hepatitis C Care
- Oncology
- Obstetrics & Gynecology
- Orthopedics
- Pediatrics
CQMC measures represent a consensus on core performance measures designed to promote evidence-based metrics for quality improvement. They are intended to improve consumer decision-making, improve value-based payment and purchasing, reduce variability in measure selection, and decrease a provider’s collection burden and cost.¹²
The Laboratory’s Role in Value-based Contracting
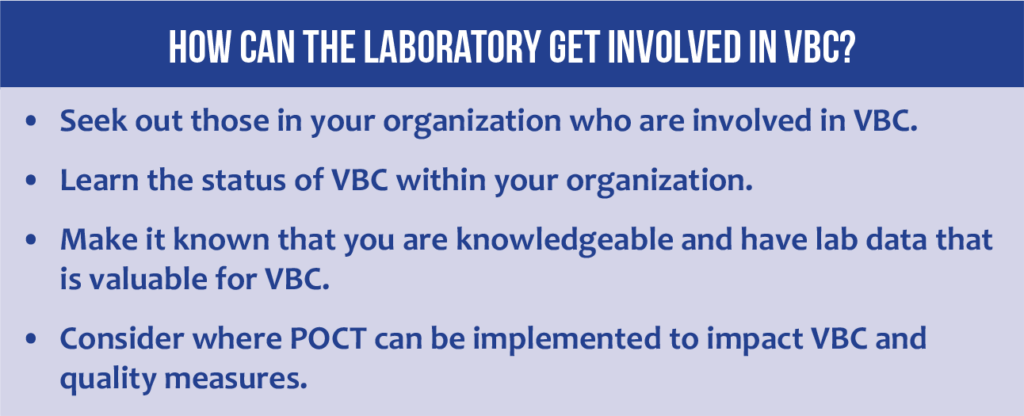
How can laboratories help patients and their healthcare organizations succeed in value-based contracting? First, it is important to have a general understanding of the payment model progression to value-based, outcome driven models. Second, laboratory professionals should learn about VBC within their parent organizations and determine which of the measures in play involve laboratory data. See Figure 7 for more ideas.
 Think about these questions, as well:
- Does your laboratory have metrics for chronic conditions that can impact VBC?
- Does your laboratory have data that can help track preventive screenings or patients who need to return for follow-up lab testing?
There are opportunities for leaders who can tie laboratory testing and/or POCT to VBC performance. Laboratory testing, and POCT, is important in the categories that are tracking adherence to preventive care protocols (e.g., colorectal cancer, cervical cancer screening) and chronic disease management (e.g., diabetes, chronic kidney disease).
A lab increases its value to patients and its parent healthcare organization by helping to ensure the organization’s success in its value-based contracts. The lab’s ability to extract and present key data—to identify underlying risky medical conditions, to adjust RAFs, to show achievement of HEDIS or other performance metrics—is very valuable to patients and the healthcare system.
Reference List
- Valence Health. Models of value-based reimbursement: A Valence Health primer. https://www.integration.samhsa.gov/about-us/VBP_White_Paper_-_Pros_and_Cons.pdf. Published 2013.
- LaPointe J. Value-based contracts with risk 3 to 5 years away for providers. RevCycleIntelligence. https://revcycleintelligence.com/news/value-based-contracts-with-risk-3-to-5-years-away-for-providers. Published March 19, 2019.
- Tetreault T. Value-based contracts – Creating win-win partnerships for health systems and suppliers. Becker’s Hospital Review. https://www.beckershospitalreview.com/healthcare-information-technology/value-based-contracts-creating-winwin-partnerships-for-health-systems-and-suppliers.html. Published March 6, 2018.
- Kaufman Hall. Signature leadership series: Value-based contracting. https://www.aha.org/system/files/hpoe/Reports-HPOE/Value-Based_Contracting_KaufHall_2013.pdf. Published July 2013.
- AgingInPlace. What is a Medicare 5-star plan? https://www.aginginplace.org/what-is-a-medicare-5-star-plan/. Published 2019. Updated February 2020.
- McManus J. Medicare Advantage: The solution to value-based care. Life Science Leader. https://www.lifescienceleader.com/doc/medicare-advantage-the-solution-to-value-based-care-0001. Published June 22, 2018.
- AAPC. HCC model. https://www.aapc.com/risk-adjustment/hcc-model.aspx. Published date unknown.
- Aetna. HEDIS 101 for providers. https://www.aetnabetterhealth.com/kentucky/assets/pdf/providers/HEDIS/hedis-101-for-providers.pdf. Published 2017.
- CMS.gov. HEDIS. https://www.cms.gov/Medicare/Health-Plans/SpecialNeedsPlans/SNP-HEDIS. Updated November 15, 2019.
- Gruessner V. How payers can improve HEDIS quality measure performance. Health Payer Intelligence. https://healthpayerintelligence.com/features/how-payers-can-improve-hedis-quality-measure-performance. Published date unknown.
- Deweese PT. The reality of success in Medicare Advantage. HealthLeaders. https://www.healthleadersmedia.com/finance/reality-success-medicare-advantage. Published October 3, 2019.
- National Quality Forum. CQMC: AHIP, CMS, and NQF partner to promote measure alignment and burden reduction. https://www.qualityforum.org/cqmc/. Published date unknown.