
Introducing Orchard Insights
We all know that laboratories manage a ton of vitally important data—patient data that is used to make medical decisions and statistical data that is used to ensure result accuracy. Nearly every challenge that the laboratory industry faces can be resolved using data. However, the challenge is storing and analyzing that data for valuable business insights. The ability to analyze data and glean those insights is the common element for success. Orchard Software now offers Orchard® Insights™—our analytics and business intelligence tool to help labs get the most out of their data.
Meeting Continuous Quality Improvement Goals
Every lab is focused on finding ways to improve—reduce errors and boost productivity. Data can be analyzed to identify areas of improvement and measure the impact of implemented changes to help laboratories in their quest for continuous quality improvement (CQI). We’ve all heard the phrase, “You can’t improve what you don’t measure.” Without quality and consistent data metrics, we end up guessing on our path to improvement.
Orchard Insights Makes Data Analysis Easy
Knowing that there’s value in lab data is one thing, but actually being able to store that data and analyze it, looking for the specific measures that your lab needs to track, is not an easy task. It’s difficult to extract, model, interpret, manage, store, and convert data into meaningful metrics that lead to better outcomes.

With the understanding that labs need to be able to gain insights from their data, Orchard Software has developed Orchard Insights—focused specifically on leveraging and analyzing the tremendous amount of data that laboratories manage. The solution provides quick access to analytic data that offers insights to aid in overall lab productivity, efficiency, and inspection-preparedness. Orchard Insights automatically takes your laboratory data and converts it into actionable metrics.
Insights Dashboards
The Orchard Insights architecture provides both real-time and deep-analysis dashboards. Dashboards are served as an application using Power BI, which includes a wide array of interactive visualization tools to dive deep into your data. At launch, there are four main dashboards, with plans for many more.
My Lab at a Look
My Lab at a Look, a real-time dashboard, gives you an “at-a-glance” view of the current state of your laboratory operations, including real-time key performance indicators (KPIs). You can compare your lab’s current state to your lab’s average, down to the specific day and time (e.g., view Wednesday 9am and compare to a typical Wednesday at 9am). Use this information to make data-supported staffing decisions, rather than trying to guess how to best staff your lab.
As another example, you can compare your current turnaround time (TAT) to your typical TAT, so when it falls below expectations, you can take immediate action to improve. This proactive interaction enables you to get ahead of problems before they become more serious.
Lab Productivity
The real-time Lab Productivity dashboard helps you take a deeper look at daily workload. You can monitor how orders are flowing through the various stages from order entry to completion. With this information, you can monitor for bottlenecks that need to be addressed. You can also compare your current throughput for each stage to your average to better understand lab performance and make quick adjustments along the process to catch up.
Population Studies
Population Studies is an interactive, deep-analysis dashboard that gives you access to all your lab test results and allows you to drill down into that data. For example, by selecting a test, you can see the full spectrum of results for that test for easy reference range establishment or verification. Establishing reference ranges by age and sex has never been easier. This interactive dashboard saves hours of work, eliminates errors, and replaces a cumbersome manual process.
Lab Corrections
Laboratories are always looking for ways to improve. In the spirit of CQI, the Lab Corrections dashboard allows you to easily see patterns and trends to find opportunities to improve. This dashboard provides a view of corrections so that you can identify tests that have the most corrections and the reasons. You can filter any of these elements to see the data you need and use that information for quality assurance initiatives. Laboratory managers can quickly and easily review their data to identify areas to reduce errors and monitor progress over time.
Architecture Provides Secure Data Storage
Orchard Insights is supported by robust back-end data processing and warehousing within Azure Synapse, an industry-leading analytics platform. Synapse is used to securely transform and store data in a standardized data model tailored specifically for your Orchard application. As your data is being extracted and processed, each record is tagged for your account, which enables top security features such as row-level security, ensuring that only you see your data.
Azure Synapse transforms and models the data into an operational data store that contains a snapshot of your most recent data, which provides the real-time reports. Data is processed further into an enterprise data warehouse to facilitate the deep analysis reporting. This setup allows secure access to your data and its insights without taxing your production system.
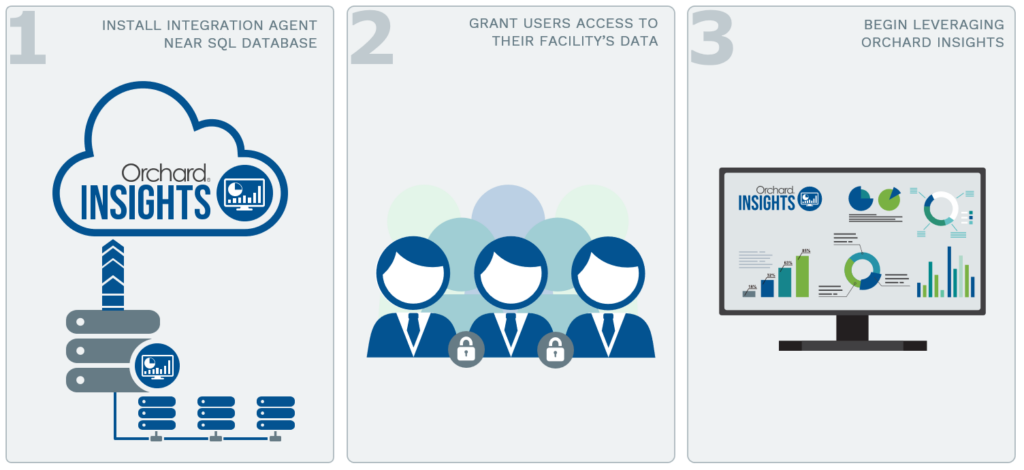
Easy Implementation
As an ad-on to your laboratory information system (LIS), implementation of Orchard Insights is quite simple. First, a data extract agent is installed near your Orchard application’s SQL server to perform regular data extractions. Then we grant access to designated users. From there, you can begin viewing your lab’s data, including historical data.
Significant ROI
Orchard Insights is an all-in-one subscription service that completely eliminates the headaches and costs of designing, creating, and maintaining your own analytics platform. This means it eliminates costs for:
- Supporting infrastructure
- Data scientist fees to design and build, perform data modeling, and keep up to date
- Long-term maintenance
Plans For Insights Expansion
Over time, Orchard Insights will leverage modern generative and predictive AI engines to reveal operational and clinical trends. This will further empower organizations to streamline processes and realize new efficiencies. Orchard is working with an early adopter program for the solution, which will provide those customers that purchase the solution in 2023 with incentives and opportunities to participate in the design of future versions of the solution, including additional dashboards.
Manual data analysis is expensive and challenging. Instead, leverage Orchard’s 30 years of expertise and innovation in the laboratory and technology industry to reap the benefits of Orchard Insights today. Contact us to learn more and to become an early adopter of this powerful solution.