
Laboratories amass a tremendous amount of data that is often not used to its full potential because there is no easy way to access and analyze that data. Laboratory data can be used to:
- Track internal lab performance to improve efficiency
- Pilot patient care initiatives such as population health
- Support data-driven business decisions when combined with other data sets for organization-wide insights
To make the most of their data, laboratories need an analytics solution that can analyze and present data in a user-friendly manner.
What is laboratory analytics software & what does it measure?
Labs are focused on producing and reporting rapid, accurate results so that providers can use those results to diagnose and treat patients quickly. To report accurate results, labs have strenuous quality control (QC) and quality assurance (QA) programs in place. These quality improvement measures can be managed more easily with a business intelligence and analytics software designed specifically for the lab and the type of data it collects. Laboratory analytics software can help labs understand their laboratory operations quickly and eliminate manual data tracking.

How can labs use laboratory analytics software to improve efficiency?
Each analyzer, when installed, requires accuracy, precision, linearity, reference range verification, and correlation studies to ensure that results reported are accurate for a lab’s specific patient population. This process creates large data sets that can be cumbersome to manage in a spreadsheet and opens the opportunity for human error. Having laboratory analytics software that can take that data and quickly create or validate a reference range is a huge efficiency and accuracy boost for labs.
Improve Diagnostic Decision Making
By understanding the lab’s daily performance and having quality improvement processes in place, laboratories improve their overall efficiency and increase productivity. Having an analytics tool that enables that type of tracking and data insights boosts lab efficiency and subsequently improves lab services and diagnostic decision making.
Improve Patient Outcomes
Similar to the benefit of improving diagnostic decisions, having an analytics software that identifies QA trends for test result corrections or amendments and uncovers opportunities to reduce errors has the downstream result of improved patient care. Further, tracking test-specific tendencies in patient populations makes it easy to establish reference ranges and identify areas to invest in population health initiatives.
Improve Overall Laboratory Productivity & Efficiency
Laboratories strive for continuous quality improvement (CQI)—always looking for areas and ways to improve lab efficiency. Part of CQI means having an effective QA program with key performance indicators that change over time as the lab’s needs change. To support a strong QA program, laboratories can benefit from software that analyzes lab operations, tracks performance, and actively looks for areas to improve. Lab analytics software gives labs the ability to monitor trends over time to achieve efficiency improvements.
 Make Better Staffing Decisions
Laboratories can benefit from an analytics software that tracks staffing over time alongside their workload. Using that information, lab managers can make data-backed staffing schedules. Managers can create staffing schedules based on workload by time of day or shift. This methodology of “just right” staffing can help alleviate staffing shortages, a current industry-wide issue.
Be Active Participants in Laboratory Stewardship
Laboratory stewardship programs include four components:
- Governance
- Interventions
- Data extraction and monitoring
- Continual assessment and improvement1
Laboratories can use their data to track performance and test utilization as part of a laboratory stewardship program. Having an analytics tool can greatly enhance the ability to perform data extraction and monitoring and supports continual assessment for improvement. This information can guide business decisions and increase the lab’s contribution to patient care improvements.
Provide Benchmarking Tools
In line with CQI, laboratories can benefit from understanding how they perform compared to other labs (e.g., processing times and turnaround times). With a comprehensive analytics tool, benchmarking data can be obtained to gain those insights, and find areas to improve. Benchmark data can be used to compare against reimbursements to make decisions around purchasing (lab equipment, reagents, etc.), staffing, and test menu options.

Improve Your Lab Profitability
Labs are always striving to run as cost efficiently as possible. With analytics software, labs can securely share data to support broader organizational insights that guide financial and business decisions. Laboratory data combined with other healthcare data can be used to guide decisions in matters of patient care and spending.
Who needs laboratory data analytics software?
Every business can benefit from analytics to help guide their financial and staffing decisions. The healthcare industry uses data analytics for a tremendous amount of business and patient care decisions. All types of laboratories can gain valuable insights from a lab-focused analytics tool that enables a drill-down into their data.
Hospitals & IDNs
In a large hospital or integrated delivery network (IDN), data is analyzed for a plethora of reasons, including patient risk stratification, clinical decision support, patient trends for alerts, patterns of opioid abuse, predictive analytics, hospitalization risk for patients with chronic conditions, billing and insurance claims, and more.
Specific to the lab, data can be used for population health initiatives as part of proactive healthcare. Lab data combined with other clinical data can be used to risk-stratify patients into groups that can then be tracked and communicated with based on their level of health risk. Having an analytics tool that supports this within a hospital lab can be a valuable resource.
Public Health Labs
Public health labs strive to keep us healthy, safe, and informed regarding infectious diseases and other health hazards. In public health, data is collected and analyzed to make decisions about the health of populations. Data analysts look for trends (e.g., significant increases in mortality rates among a specific population). By collecting and analyzing important health metrics, public health laboratories work together to combat disease. Using amassed data, public health experts define policies designed to keep communities safer and healthier.
Veterinary Labs
Veterinarians use statistical analysis to impose appropriate regulations and prevent diseases from spreading. Analyzing livestock productivity, controlling existing pathogens, preventing the introduction of new diseases, and mitigating antimicrobial resistance are all areas where data analytics can be used. Veterinary syndromic surveillance systems use laboratory data for disease monitoring of companion animals, cattle, swine, horses, etc. to aid veterinarians and producers.
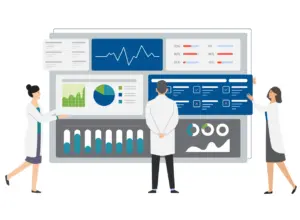
How can Orchard® Insights™ help your lab?
Orchard Insights can take the time-consuming process of data analytics and put that data immediately at your fingertips. Laboratories can gain internal lab insights for staffing productivity, test utilization, turnaround times, test corrections, and more. Real-time lab analytics can increase productivity, reduce costs, and contribute to improved patient care.
![]()
Includes Data Warehousing
With Orchard Insights, your data is available in a data warehouse, securely shared to support broader organizational goals and guide financial and business decisions. When laboratory data is combined with other healthcare data, you are able to make more informed decisions about patient care and spending.
Leverages Microsoft Azure Analytics & BI Platform
Orchard Insights is a standalone solution (i.e., SaaS) that securely stores and analyzes your data using Microsoft Azure Analytics and Power BI. With this architecture, data queries do not impact your production application’s performance.
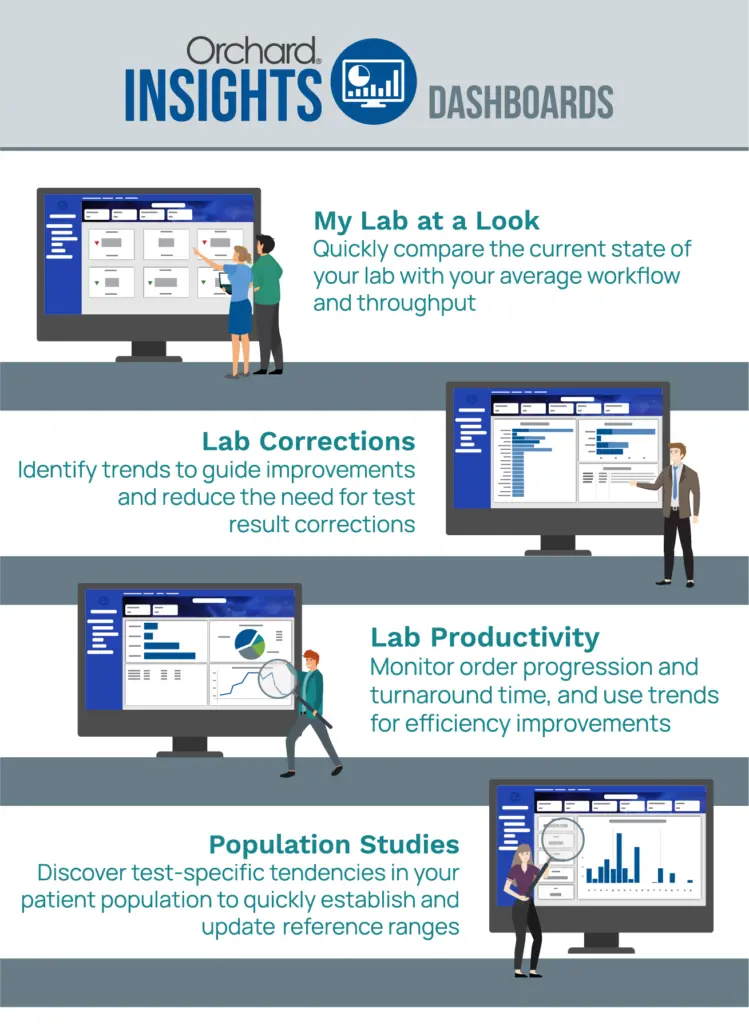
Provides Real-time & Deep Analysis Dashboards
Orchard Insights offers both real-time and deep analysis dashboards. The interactive dashboards allow you to swiftly filter and drill down into your data. Real-time dashboards can track daily workload, testing volumes, and provider orders, and display current throughput and order status through each testing phase.
For more information about the value of laboratory analytics, read our white paper, The Incredible Value of Laboratory Data & Analytics.
Reference
- Dickerson JA, et al. Transforming laboratory utilization review into laboratory stewardship: Guidelines by the PLUGS National Committee for Laboratory Stewardship. J Appl Lab Med. 2017;2(2):259-68. doi: 10.1373/jalm.2017.023606.